


Page 18 - 2516_ISLA_Market_Report_-_Jan_2026_final
P. 18
18                                                                                                                                                                                                                        19

                 Securities Lending Market Report | H2 2025


             North America


      >>>    Equities

             H2 2025 marked a period of normalization in equity markets. While broad indices traded within relatively contained ranges
             compared with earlier post-pandemic volatility, securities lending activity remain highly episodic, stock-specific, and event
             driven.
             US market utilization, fees, and revenue were increasingly   Demand was mostly driven by the valuation normalisation
             concentrated in a narrow subset of names, while most of   trades following strong multi-year rallies in technology and
             the equity lending market remained firmly in GC demand.   AI-adjacent names, derivatives-linked borrowing driven
             This reinforced a structural shift that has been developing   by elevated single-stock options volumes and structured
             over several years: US equities lending is no longer driven by   products.
             market-wide hedging cycles, but by micro-level narratives,   Derivatives-related borrow demand became increasingly
             including corporates actions and derivatives positioning.
                                                                important. Market makers and volatility traders required
             Lendable supply of US equities remained strong throughout   reliable access to underlying shares to hedge delta exposure
             H2 2025. Passive investment – particularly ETFs continued   leading to persistent baseline demand in certain liquid single
             to grow providing stable and predictable source of lendable   names.
             inventory for large-cap stocks.                                                                                                             ISLA 33rd Annual
                                                                Corporate actions were an important part of H2 2025 US
             However, effective supply was materially more constrained   securities lending equities via M&A announcements, spin-
             due increased recall activity (around proxy voting, index   offs, tender offers, and shares buybacks generating increases
             rebalancing, and corporate actions) and more conservative   in borrow demand. Convertible bond issuance also played a   Securities Finance & Collateral
             internal risk limits applied by beneficial owners including   role as hedging activity drove incremental short demand in
             internal haircuts and counterparty caps.           underlying equities further tightening supply in already active
                                                                names.
             As a result, supply flexibility declined when demand spiked,                                                                      Management Conference
             contributing to sharper rate moves and shorter-lived trade but   Overall, H2 2025 revenue delivered moderate growth,
             more intense hard-to-borrow conditions.            revenue volatility remained elevated with month-to-month
                                                                outcomes heavily influenced by deal calendars and sector
             Directional macro shorts were relatively limited as most of   specific news flow.
             hedge funds avoided broad index positioning in favour of                                                                                              15-18 JUNE, 2026
             relative value and pair-trade strategies.


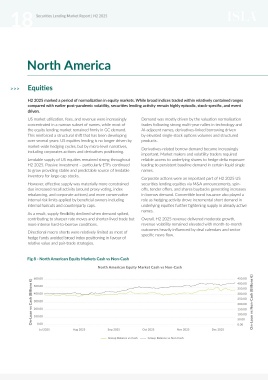
             Fig 8 - North American Equity Markets Cash vs Non-Cash
                                            North American Equity Market Cash vs Non-Cash                 450.00

               On-Loan vs Cash (Billions €) 600.00                                                        350.00 On-Loan vs Non-Cash (Billions €)           LEARN MORE
                                                                                                          400.00
                500.00
                400.00
                                                                                                          300.00
                                                                                                          250.00
                300.00
                                                                                                          200.00
                200.00
                                                                                                          150.00
                                                                                                          100.00
                100.00
                 0.00
                                                                                                          0.00
                  Jul 2025       Aug 2025        Sep 2025       Oct 2025        Nov 2025       Dec 2025   50.00
                                                                                                                                                                     For all conference information:
                                                 Group Balance vs Cash  Group Balance vs Non Cash
                                                                                                                                                                     events@islaemea.org | www.islaemea.org

