


Page 20 - 2516_ISLA_Market_Report_-_Jan_2026_final
P. 20
20                                                                                                                                                                                                                        21

                 Securities Lending Market Report | H2 2025


      >>>    Fixed Income


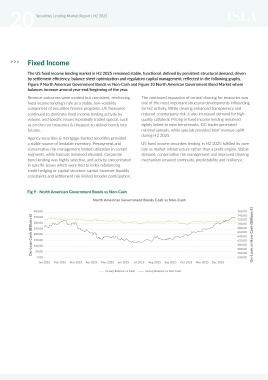
             The US fixed income lending market in H2 2025 remained stable, functional, defined by persistent structural demand, driven   Fig 10 - North American Government Bonds vs Non-Cash
             by settlement efficiency, balance sheet optimization and regulatory capital management, reflected in the following graphs,                               North American Government Bond Market
             Figure 9 North American Government Bonds vs Non-Cash and Figure 10 North American Government Bond Market where
             balances increase around year-end/beginning of the year.
                                                                                                                                        3.30                                                                                     1.10
             Revenue outcomes were modest but consistent, reinforcing   The continued expansion of central clearing for treasuries was
             fixed income lending’s role as a stable, low-volatility   one of the most important structural developments influencing    3.20                                                                                     1.05
             component of securities finance programs. US Treasuries   for H2 activity. While clearing enhanced transparency and        3.10                                                                                     1.00
             continued to dominate fixed income lending activity by   reduced counterparty risk, it also increased demand for high-     3.00                                                                                     0.95
             volume, and specific issues repeatedly traded special, such   quality collateral. Pricing in fixed income lending remained   Lendable Value (Trillions €)                                                                  On-Loan Value (Trillions €)
             as on-the-run treasuries & cheapest-to-deliver bonds into   tightly linked to repo benchmarks. GC trades generated         2.90                                                                                     0.90
             futures.                                           minimal spreads, while specials provided brief revenue uplift           2.80                                                                                     0.85
                                                                during H2 2025.
             Agency securities & mortgage-backed securities provided                                                                    2.70                                                                                     0.80
             a stable source of lendable inventory. Prepayment and   US fixed income securities lending in H2 2025 fulfilled its core    Jan 2025  Feb 2025  Mar 2025  Apr 2025  May 2025  Jun 2025  Jul 2025  Aug 2025  Sep 2025  Oct 2025  Nov 2025  Dec 2025
             conservative risk management limited utilization in certain   role as market infrastructure rather than a profit engine. Stable
             segments, while haircuts remained elevated. Corporate   demand, conservative risk management and improved clearing                                             Group Lendable  On-Loan Balance
             bond lending was highly selective, and activity concentrated   mechanism ensured continuity, predictability and resilience.
             in specific issues which were tied to index rebalancing
             credit hedging or capital structure capital, however liquidity
             constraints and settlement risk limited broader participation.


             Fig 9 - North American Government Bonds vs Non-Cash

                                          North American Government Bonds Cash vs Non-Cash

                400.00                                                                                    760.00
                                                                                                          740.00
               On-Loan Cash (Billions €)  250.00                                                          700.00 On-Loan vs Non-Cash (Billions €)  Introducing the
                350.00
                                                                                                          720.00
                300.00
                                                                                                          680.00
                                                                                                          660.00
                200.00
                                                                                                          640.00
                                                                                                                               ISLA Securities Lending
                150.00
                                                                                                          620.00
                                                                                                          600.00
                100.00
                 50.00
                                                                                                          560.00
                                                                                                          540.00
                 0.00                                                                                     580.00
                  Jan 2025  Feb 2025  Mar 2025  Apr 2025  May 2025  Jun 2025  Jul 2025  Aug 2025  Sep 2025  Oct 2025  Nov 2025  Dec 2025  & Borrowing Hub
                                                Group Balance vs Cash  Group Balance vs Non Cash
                                                                                                                               Your ultimate resource for all securities lending
                                                                                                                               and borrowing information


                                                                                                                                   Learn about the Key Market Participants
                                                                                                                                   Deep Dive into the Benefits of Securities Lending

                                                                                                                                   Get your Questions...Answered

                                                                                                                                   Access the Latest Market Data

